
Weekly Market Report: Week of January 20, 2026
Presented by Walters Wealth Management
—
Breadth was the positive story in equity markets (though it was masked by weaker headline returns for the major large-cap indices). An example was the small-cap Russell 2000, which continued its recent strong performance, rising 2 percent. Markets reacted to earnings and economic reports that showed sticky inflation and strong consumer spending.
Quick Hits
1. Beyond the headlines: Managing risk in an uncertain world.
2. Report releases: Economic data showed that inflation remained sticky and consumer spending continued to exceed expectations.
3. Financial market data: Although major indices were down, strong market breadth was a positive takeaway.
4. Looking ahead: This week’s highlights include fourth-quarter earnings reports and personal income and spending data.
Keep reading for an in-depth look.
Beyond the Headlines: Managing Risk in an Uncertain World
The consensus as 2026 gets underway is sanguine. Few (if any) economists are calling for a U.S. economic recession despite concerning trends in employment and inflation. Contrast this to late 2022, when almost everyone was forecasting a recession in 2023, which never occurred. The current upbeat outlook for the economy has led to optimism from analysts, who expect 2026 earnings growth for S&P 500 companies of more than 14 percent.
Part of any good investment process is to consider risks when the market seems to be discounting sunny days ahead. Timing markets is impossible, and positioning portfolios for the next stock sell-off can result in missing upside to portfolios. But that doesn’t mean taking the time to be sure that long-term objectives are achieved—whether the market is on its way up or down—isn’t worthwhile.

See how this week’s market moves could impact your goals – let’s talk strategy.
Early Reminders of an Uncertain World
The first few weeks of the year have been rife with reminders that the world today is an uncertain place. All the possible known risks have been in the headlines; there have been multiple global risks affecting markets.
Geopolitical hot spots have also led to a reminder about policy threats, with additional tariffs back on the table in Europe. Risks surrounding the Federal Reserve (Fed), its independence, and the path of interest rates have also received plenty of airtime.
A sell-off of some magnitude, usually at least a double-digit percentage decline, occurs most years. Yet, over the past twenty-three years, in only four of those did the S&P 500 post a negative return—and in two of those years, the returns were in the single digits (1 percent and 6 percent). It wouldn’t be surprising if we saw a similar correction at some point in 2026. Last year, after experiencing a 19 percent decline early in the year, the market rallied to increase nearly 18 percent, including dividends. The lesson of 2025? Policy can change, and headlines can dissipate.
Market Shows Signs of Broadening
Although timing the market isn’t an investment process, doing nothing isn’t one, either. The market is showing signs of broadening. The equal-weighted S&P 500 closed higher last week, even though the market cap–weighted S&P 500 declined. For the year, the equal-weighted index has outperformed the more popular market cap–weighted one. At the same time, the small-cap Russell 2000 Index finished the week at an all-time high. Investors have been rotating out of the large growth companies that have driven returns over the past few years—and the rest of the market is benefiting. Lastly, international stocks were strong outperformers last year, with returns of more than 30 percent. With improving fundamentals overseas, international markets are benefiting from concerns about the U.S. economy.
Headlines are hard to ignore, and market declines lead to heightened concerns and emotions. The best strategy, however, is to focus on long-term objectives and seek opportunities that result from short-term market moves.
Report Releases—January 12–16, 2026
Consumer Price Index (CPI): December (Tuesday)
Consumer inflation last month was largely in line with economist expectations.
· Expected monthly CPI/core CPI growth: +0.3%/+0.3%
· Actual monthly CPI/core CPI growth: +0.3%/+0.2%
· Prior year-over-year CPI/core CPI growth: +2.7%/+2.6%
· Expected year-over-year CPI/core CPI growth: +2.7%/+2.7%
· Actual year-over-year CPI/core CPI growth: +2.7%/+3.6%
Producer Price Index (PPI): November (Wednesday)
The delayed release of October and November PPI reports showed higher-than-anticipated producer inflation.
· Prior monthly PPI/core PPI growth: +0.1%/+0.4%
· Expected monthly PPI/core PPI growth: +0.2%/+0.2%
· Actual monthly PPI/core PPI growth: +0.2%/+0.3%
· Prior year-over-year PPI/core PPI growth: +2.8%/+2.9%
· Expected year-over-year PPI/core PPI growth: +2.7%/+2.5%
· Actual year-over-year PPI/core PPI growth: +3.0%/+2.9%
Retail Sales: November (Wednesday)
The shutdown-delayed November retail sales report showed a welcome rebound in sales growth.
· Expected/prior month retail sales monthly change: +0.5%/–0.1%
· Actual retail sales monthly change: +0.6%
The Takeaway
· Economic data showed that inflation remains sticky, with the December CPI and the November PPI well above the Fed’s preferred target of 2 percent.
· Retail sales were better than expected. After a weak October, strong November sales were a positive for economic growth.
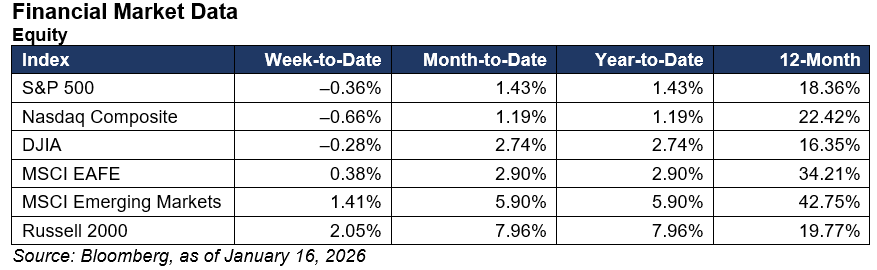
Equity markets were mixed, with most indices down slightly. The small-cap Russell 2000 was strong once again, however, rising more than 2 percent. The market displayed more breadth; the equal-weight S&P 500 outperformed the market cap–weighted S&P 500. That amplitude was seen in sector performance, with strength seen in real estate, consumer staples, industrials, energy, and materials. Underperforming sectors were financials, consumer discretionary, communication services, and health care.
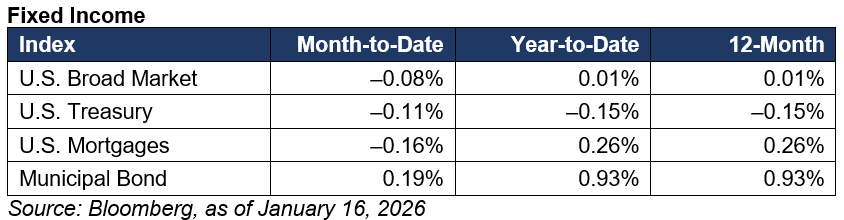
Fixed income markets were also weaker. The Treasury yield curve flattened, with 10-year yields increasing roughly five basis points (bps) and 2-year yields rising 11 bps.
The Takeaway
· Equity markets were soft but breadth was strong, highlighted by increases in the Russell 2000 (up more than 2 percent) and the equal-weight S&P 500.
· Bonds were weak, with yields on Treasury bonds higher across the board.
Looking Ahead
This week, we expect several high-profile corporate earnings reports, data on the health of the manufacturing and services economy, and consumer income and spending metrics.
On Thursday, we expect updates on personal income and spending. Both are expected to rise, which would be a good sign for economic growth.
On Friday, we’ll get a snapshot of the U.S. economy with the release of the January S&P Global Manufacturing/Services Purchasing Managers Index (PMI).
Throughout the week, we’ll receive notable fourth-quarter earnings reports from companies from various industries, including banks, technology, health care, and oil and gas.
Disclosures: This material is intended for informational/educational purposes only and should not be construed as investment advice, a solicitation, or a recommendation to buy or sell any security or investment product. Diversification does not assure a profit or protect against loss in declining markets, and diversification cannot guarantee that any objective or goal will be achieved. Please contact your financial professional for more information specific to your situation.
Bonds are subject to availability and market conditions; some have call features that may affect income. Bond prices and yields are inversely related: when the price goes up, the yield goes down, and vice versa. Market risk is a consideration if sold or redeemed prior to maturity.
Certain sections of this commentary contain forward-looking statements that are based on our reasonable expectations, estimates, projections, and assumptions. Forward-looking statements are not guarantees of future performance and involve certain risks and uncertainties, which are difficult to predict. All indices are unmanaged and are not available for direct investment by the public. Past performance is not indicative of future results. The S&P 500 is based on the average performance of the 500 industrial stocks monitored by Standard & Poor’s. The Nasdaq Composite Index measures the performance of all issues listed in the Nasdaq Stock Market, except for rights, warrants, units, and convertible debentures. The Dow Jones Industrial Average is computed by summing the prices of the stocks of 30 large companies and then dividing that total by an adjusted value, one which has been adjusted over the years to account for the effects of stock splits on the prices of the 30 companies. Dividends are reinvested to reflect the actual performance of the underlying securities. The MSCI EAFE Index is a float-adjusted market capitalization index designed to measure developed market equity performance, excluding the U.S. and Canada. The MSCI Emerging Markets Index is a market capitalization-weighted index composed of companies representative of the market structure of 26 emerging market countries in Europe, Latin America, and the Pacific Basin. The Russell 2000® Index measures the performance of the 2,000 smallest companies in the Russell 3000® Index. The Bloomberg US Aggregate Bond Index is an unmanaged market value-weighted performance benchmark for investment-grade fixed-rate debt issues, including government, corporate, asset-backed, and mortgage-backed securities with maturities of at least one year. The U.S. Treasury Index is based on the auctions of U.S. Treasury bills, or on the U.S. Treasury’s daily yield curve. The Bloomberg US Mortgage Backed Securities (MBS) Index is an unmanaged market value-weighted index of 15- and 30-year fixed-rate securities backed by mortgage pools of the Government National Mortgage Association (GNMA), Federal National Mortgage Association (Fannie Mae), and the Federal Home Loan Mortgage Corporation (FHLMC), and balloon mortgages with fixed-rate coupons. The Bloomberg US Municipal Index includes investment-grade, tax-exempt, and fixed-rate bonds with long-term maturities (greater than 2 years) selected from issues larger than $50 million. One basis point is equal to 1/100th of 1 percent, or 0.01 percent. One basis point (bp) is equal to 1/100th of 1 percent, or 0.01 percent.
Walters Wealth Management is located at 16201 Norum Rd NE, Poulsbo, WA 98370 and can be reached at 360-364-1777. Nate Walters and Tyler Walters use the trade name Walters Wealth Management. All securities and advisory services offered through Commonwealth Financial Network®, member FINRA/SIPC, a Registered Investment Adviser. Fixed insurance products and services are not offered through and are separate from Commonwealth.
Authored by the Investment Research team at Commonwealth Financial Network®.
© 2026 Commonwealth Financial Network®